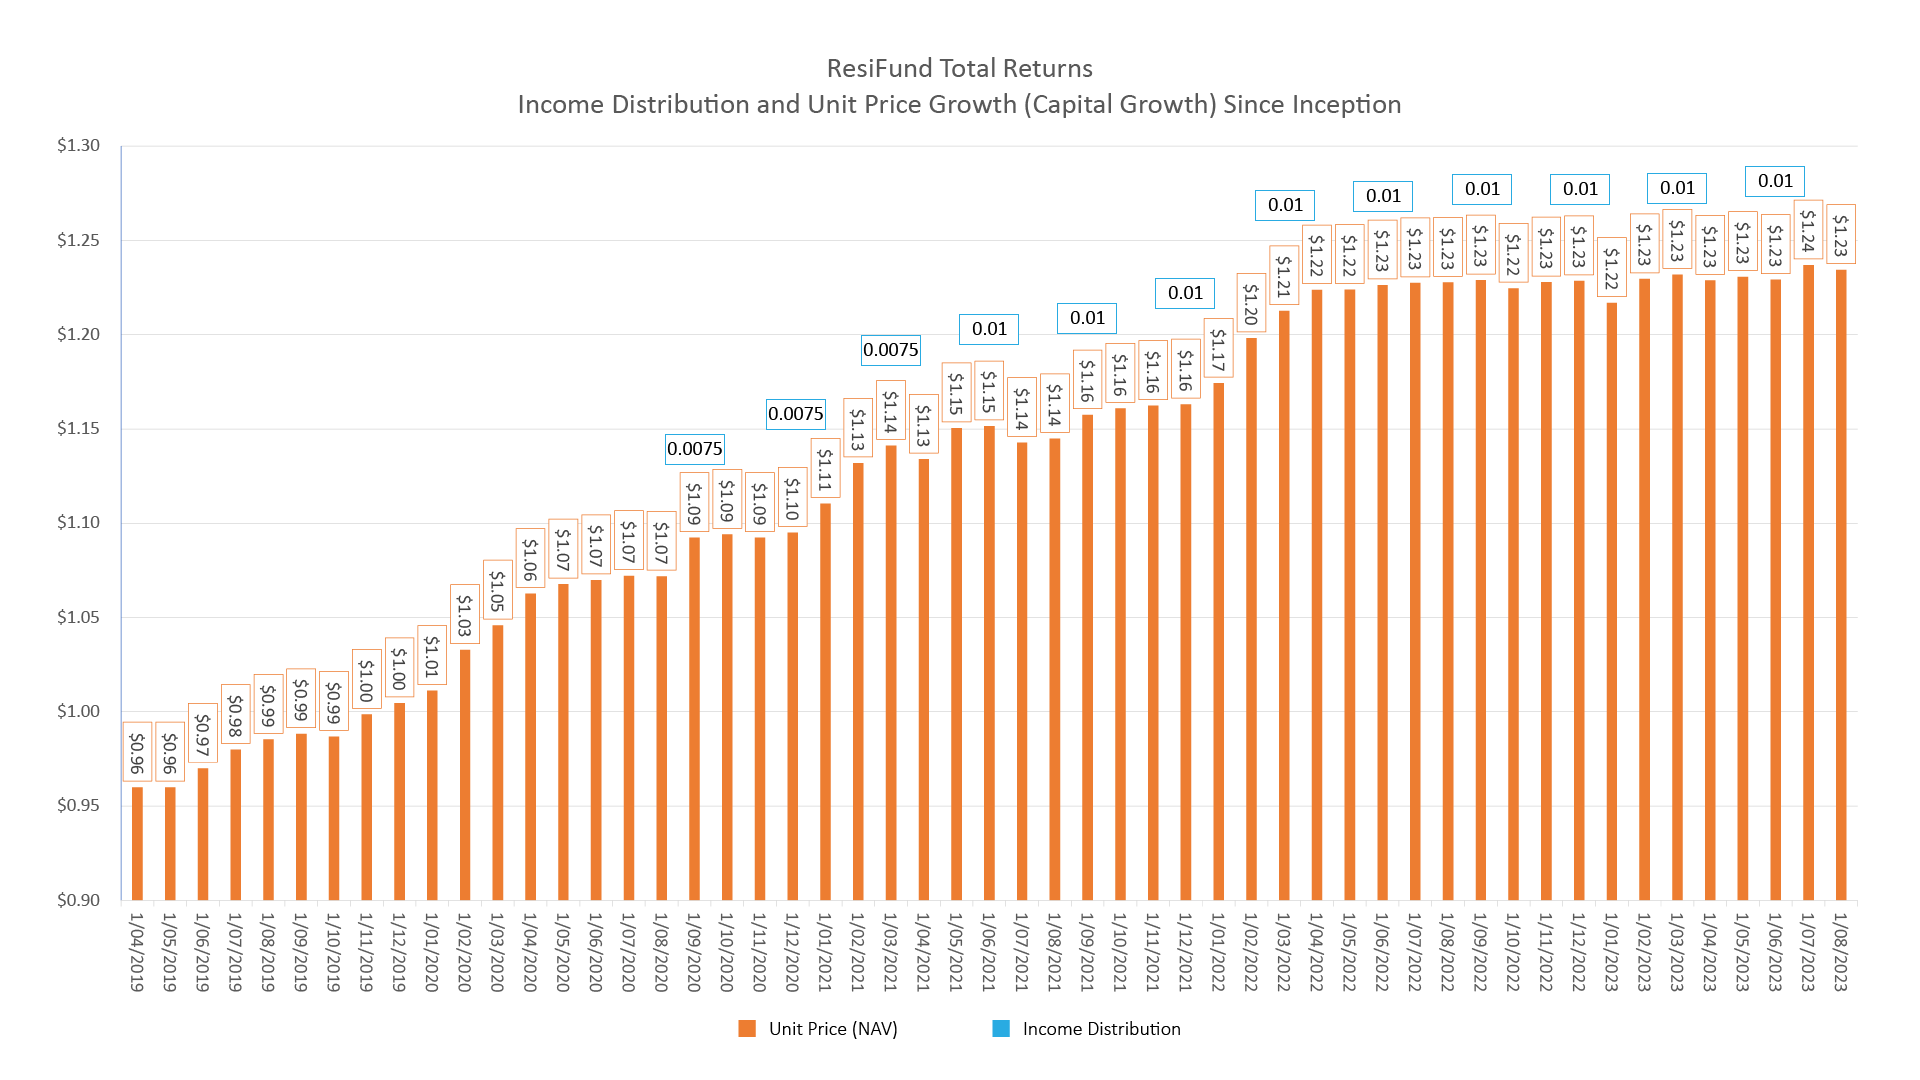
ResiFund Investment Performance, Unit price and Distribution history
- ResiFund’s returns comprise both income returns from the rent we generate from leasing properties, as well as any capital growth in the value of the properties.
- The income returns for ResiFund investors are paid quarterly and are called income distributions, which are very similar to a company paying dividends. These income returns can either be paid as a cash distributions into an investors bank account, or through the allotment of additional units in ResiFund.
- ResiFund’s capital growth, or in other words the growth in the value of the properties, is reflected in our monthly unit price, which is like a share price.
- As the values of the properties increases in value over time, so too does the unit price.

(click to open full size image)